Guide · 4 min read
How to export OTDR results to Excel
To export OTDR results to Excel, open your .sor files in the OTDR Wizard viewer, select Export, choose Excel and pick the sheets you want. You get one .xlsx workbook with a sheet per table (summary, events, parameters, trace points), with every file in the same sheet and a File column to filter by. For other software, the same tables are available as CSV.
Export to an Excel workbook
1. Open the files
Open one file or a whole job. See how to open a SOR file.
2. Choose Excel and the sheets
Select Export in the top bar, then Excel.
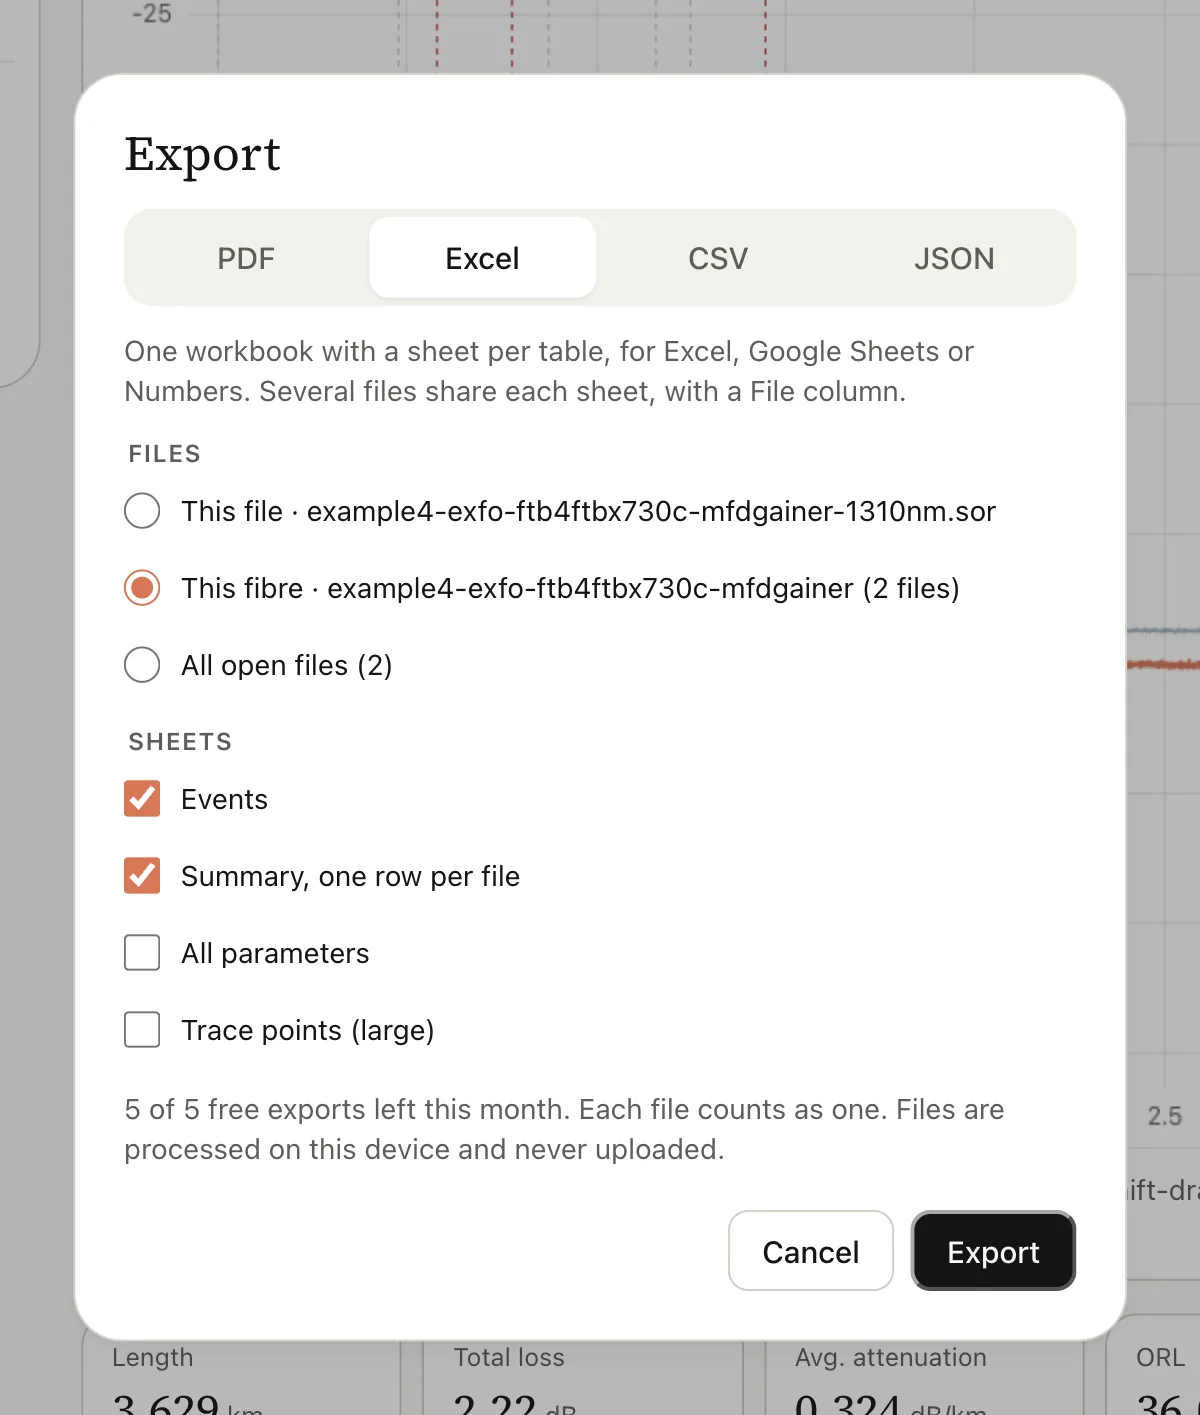
- Files: this file, this fibre or all open files. Several files go into the same sheets, one after the other.
- Sheets: tick the tables you need. Summary and Events are ticked by default.
- Export downloads one workbook, for example
OTDR-Data_All_files_2026-11-18.xlsx.
3. Open it in Excel, Google Sheets or Numbers
Numbers are stored as real numbers, so Excel shows them with your own decimal separator and you can sort and sum straight away. The header row is frozen and has filters turned on. Filter the File column to look at one trace, or Status to see only the failures.
What is in each sheet
Summary
One row per file:
| Column | What it holds |
|---|---|
| File, Fibre | The file name, and the fibre it belongs to (files like ODP12_1310.sor and ODP12_1550.sor share one fibre name) |
| Cable ID, Fibre ID | As entered on the instrument |
| Wavelength (nm), Pulse (ns), Test date | Test settings; the date is in ISO format (UTC) |
| Length (km) | Distance to the fibre end event |
| Total loss (dB) | End-to-end loss measured and stored by the OTDR |
| Cumulative loss at end (dB) | Our running total at the fibre end; see cumulative vs total loss |
| Avg. att. (dB/km), ORL (dB) | Average fibre attenuation and optical return loss |
| Events, Worst event, Worst (dB) | Number of events and the one with the highest loss |
| Status, Issues | Pass or Fail against your limits, and how many events failed |
| Instrument, SHA-256 | Maker and model, and a fingerprint of the original file |
Events
One row per event, the same as the viewer’s event table: #, Type, Manual, Distance (km), Section (km), Loss (dB), Refl. (dB), Att. (dB/km), Att. source, Cumulative loss (dB), Status, Reason, Event code and Comment. Att. source says whether the attenuation was stored by the OTDR or measured from the trace. Reason explains each failure in words. The event table guide explains every column.
Values keep their full precision, for example distance to the metre and loss to 0.001 dB. The viewer and the PDF round them for reading.
Parameters
Four columns: File, Group, Parameter and Value. Every value from the Parameters tab is here: fibre, acquisition, instrument and file details, plus the SHA-256 of the file and any corrections the viewer applied. See SOR file parameters for what each one means.
Trace points
Every sample of the trace: File, Distance (m) and Level (dB). A single trace is often 15,000 to 60,000 rows, so it is unticked by default. Use it to draw the trace yourself or compare it with another tool.
Export to CSV instead
Choose CSV for scripts, databases or software that does not read .xlsx. The tables and columns are the same as in Excel.
- One table gives one
.csvfile. Several tables come as a.zipwith one CSV each. - Number format: comma separated with a decimal point (Google Sheets, scripts, English Excel), or semicolon separated with a decimal comma (Excel set to Indonesian or most European languages). The viewer picks one from your browser language; you can change it.
- Files are UTF-8 with a byte order mark, so Excel shows names and symbols like “—” correctly.
- Text that starts with
=,+,-or@gets a leading apostrophe, so a spreadsheet never runs it as a formula.
And JSON
For software and archives, JSON holds everything in one file: the values from the file, the analysis next to them, the trace points and, if you like, the raw values exactly as stored. Missing values are null, never 0.