Guide · 4 min read
How to convert a SOR file to PDF
To convert a SOR file to PDF, open it in the OTDR Wizard viewer, select Export, choose PDF and select Export again. You get a test report with the pass/fail result, the trace with numbered events, the event table and, if you want, every parameter in an appendix. It is made in your browser, so the file is never uploaded, and the free plan includes 5 exports a month.
Before you start
- Open the
.sorfile, or several, as described in how to open a SOR file. - Check the pass/fail limits. The report uses the limits that are set in the viewer when you export, so set your project’s values first.
Make the PDF report
1. Select Export
The Export button is in the top bar once a file is open.
2. Choose PDF, the files and the report details
Export
A report to share: status, results, the trace and the event table, with every parameter in an appendix.
Files
This fileThis fibre (1310 + 1550 nm)All open filesReport
Paper sizeLetterAdd an appendix with every parameterProjectTechnicianCancelExport- Files: this file, this fibre (for example its 1310 nm and 1550 nm traces together) or all open files.
- Report: paper size (Letter or A4), an optional appendix with every parameter, and the Project, Client, Route and Technician fields. All four are optional and are remembered in this browser for your next report.
- Export makes the PDF and downloads it.
3. Download the report
The PDF downloads straight away, usually in under a second. It is named after what is in it and the date, for example OTDR-Report_ODP12_2026-11-18.pdf.
What is in the report
Each fibre starts on a new page with:
- Title and result: the fibre name and a large PASS or FAIL. The word is printed, not just coloured, so it reads the same on a black-and-white printer.
- Report details: Project, Client, Route and Technician, if you filled them in.
- Test details: cable and fibre ID, wavelength, pulse width, range, group index (IOR) and averages, instrument and serial number, test date, fibre type and the start and end locations.
- Results: length, total loss, average attenuation, ORL and number of events. A 1310/1550 nm pair gets a small table with one row per wavelength instead.
- The trace, with each event numbered and failed events marked in red. Two wavelengths share one chart, with a legend.
- The event table: distance, section, loss, reflectance, attenuation and cumulative loss for every event, followed by the reason for each failure, for example Event 2: Splice loss 0.37 dB is above 0.10 dB.
- Limits and notes: the pass/fail limits used and how to read the columns.
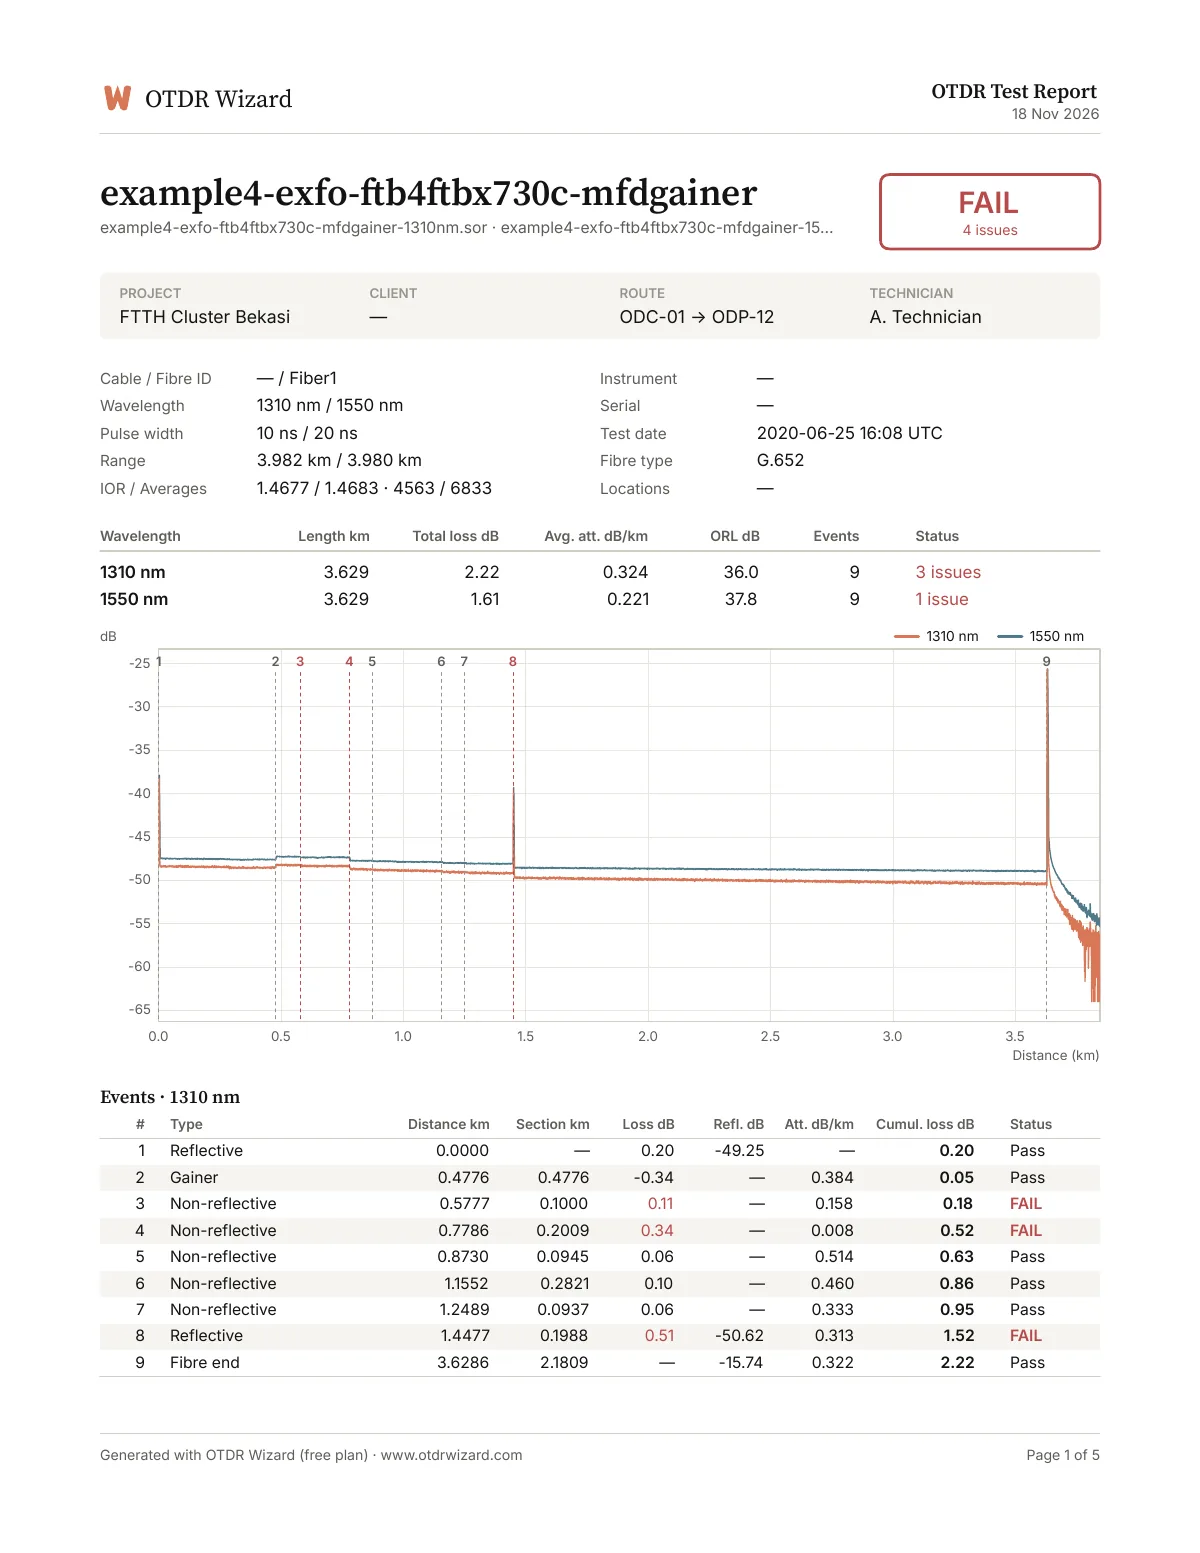
With the appendix turned on, the last pages list every parameter from the file, its size and its SHA-256 fingerprint, so the report can be matched to the exact file it came from.
One report for many fibres
Open all the files of a job, choose All open files and export. The combined report starts with a cover page:
- the number of fibres and files, and how many passed or failed;
- a summary table with one row per fibre;
- Tested by and Checked by blocks for name, signature and date. The Technician field is filled in for you.
The All files tab also has a Combined PDF report button that does the same in one step.
Free plan footer
Free reports say “Generated with OTDR Wizard (free plan)” in the footer. Paid plans will add your company logo and leave the footer plain; see pricing.
Prefer a spreadsheet?
To work with the numbers rather than share a report, export to Excel or CSV instead. See how to export OTDR results to Excel.